Market Outlook
April 19, 2017
Market Cues
Domestic Indices
Chg (%)
(Pts)
(Close)
Indian markets are likely to open flat tracking the SGX Nifty.
BSE Sensex
(0.3)
(95)
29,319
The US markets on Tuesday finished squarely in negative territory, as a spate of
Nifty
(0.4)
(34)
9,105
tepid corporate earnings weighed on the broader market. The Dow Jones Industrial
Mid Cap
(0.6)
(91)
14,296
Average dropped 0.6%, to close at 20,523 while the S&P 500 index fell 0.3%, to
Small Cap
(0.7)
(110)
14,844
end at 2,342. The Nasdaq Composite Index lost 0.1%, to close at 5,849.
Bankex
(0.0)
(4)
24,705
The UK stocks saw the biggest one-day slide in nearly 10 months on Tuesday after
Britain’s PM Theresa May called an early general election in a bid to strengthen the
government’s position ahead of Brexit negotiations with the European Union. The
Global Indices
Chg (%)
(Pts)
(Close)
FTSE 100 stumbled 2.5% to close at 7,147, marking its biggest single-session
Dow Jones
(0.6)
(114)
20,523
percentage drop since June 27 last year.
Nasdaq
(0.1)
(7)
5,849
Yesterday, Indian shares rose after three straight sessions of falls on expectations of
FTSE
(2.5)
(180)
7,148
stronger earnings. The benchmark Sensex however gave up early gains to end lower
Nikkei
0.3
63
18,419
after investors moved in to book profits. The 30-share index shed 0.32% to end at
Hang Seng
(1.4)
(337)
23,925
29,319 while NSE Nifty ended 0.37% down at 9,105.
Shanghai Com
(0.8)
(25)
3,197
News Analysis
TCS 4Q result Review
Advances / Declines
BSE
NSE
Detailed analysis on Pg2
Advances
1,105
580
Declines
1,803
1,121
Investor’s Ready Reckoner
Unchanged
136
74
Key Domestic & Global Indicators
Stock Watch: Latest investment recommendations on 150+ stocks
Volumes (` Cr)
Refer Pg6 onwards
BSE
4,297
Top Picks
NSE
28,056
CMP
Target
Upside
Company
Sector
Rating
(`)
(`)
(%)
Blue Star
Capital Goods
Accumulate
687
760
10.6
Net Inflows (` Cr)
Net
Mtd
Ytd
Dewan Housing Fin. Financials
Buy
395
460
16.6
FII
(67)
(872)
43,349
Mahindra Lifespace
Real Estate
Buy
412
522
26.8
MFs
511
3,684
13,122
Navkar Corporation Others
Buy
202
265
31.1
KEI Industries
Capital Goods
Accumulate
196
207
5.4
More Top Picks on Pg4
Top Gainers
Price (`)
Chg (%)
Adanient
145
17.7
Key Upcoming Events
Raymond
730
12.8
Previous
Consensus
Date
Region
Event Description
Reading
Expectations
Gruh
392
6.0
Apr 19, 2017 US
Industrial Production
0.11
0.50
Den
96
5.8
Apr 20, 2017 US
Initial Jobless claims
234.00
240.00
Polaris
225
5.3
Apr 20, 2017 Germany PMI Manufacturing
58.30
58.00
Apr 21, 2017 Euro Zone Euro-Zone Consumer Confidence
-5.00
-4.80
Apr 21, 2017 Germany PMI Services
55.60
55.50
Top Losers
Price (`)
Chg (%)
Apr 21, 2017 US
Existing home sales
5.48
5.60
Ibrealest
135
(9.0)
More Events on Pg5
Unitech
6
(6.3)
Hdil
88
(5.8)
Rtnpower
9
(5.7)
Jktyre
139
(4.5)
As on April 18, 2017
Market Outlook
April 19, 2017
Result Review
TCS (CMP: `2,321 / TP: `2,700 / Upside: 16.3%)
TCS announced its 4QFY2017 results today. The company, posted revenue of
US$4,452mn V/s US$4,470mn expected with 1.5% qoq growth mostly volume
led, which was 1.7% qoq. Constant Currency (CC) came in at 1.0% qoq. In rupee
terms, revenues are expected to de-grow by 0.3% qoq to `29,642cr V/s `29,996cr
expectations, led by rupee appreciation.
In terms, of verticals, the company posted a CC qoq growth in the respective
segments as BFSI ( -0.4% qoq), Retail & CPG( -3.0% qoq), Communication &
media ( 7.4% qoq), Manufacturing ( 1.7% qoq), Life sciences & Healthcare ( 3.1%
qoq), Hi-Tech( 5.2% qoq), Energy Utilities( 1.4% qoq), Travel & Hospitality ( 3.6%
qoq).
In terms of geography the company posted a CC qoq growth of North America
(-1.8 qoq), Latin America( -7.3 qoq), UK ( 4.1% qoq), Continental Europe
(7.1 qoq), India( 9.3% qoq), Asia pacific( 1.9% qoq), MEA( 2.1% qoq).
In terms of client addition, clients $100M+ up by 1, $50M+ up by 4, $20M+ up
by 4 & $10M+ up by 10. Overall, attrition rate came in at 11.5%.
On the operating front, EBIT came in at 25.7% V/s 26.0% expected, a 31bps qoq
dip. PAT came in at `6,608cr V/s `6,855cr expected, down 2.5% qoq sequentially.
We maintain our buy rating with target price of `2,700.
Y/E
Sales OPM
PAT EPS ROE P/E P/BV EV/EBITDA EV/Sales
March
(` cr)
(%)
(` cr)
(`)
(%)
(x)
(x)
(x)
(x)
FY2017E
1,19,025
27.6
25,685 131.2
32.4
17.7
5.7
12.4
3.4
FY2018E
1,33,308
27.6
28,483 145.5
33.1
15.9
5.3
10.9
3.0
Economic and Political News
IMD's normal monsoon forecast lifts business sentiment
IMF revises India's growth forecast to 6.8% in FY17
Gold imports surge to $4.17 billion in March
Modi govt to lend `1-L loan each to 8.5 cr poor households at lower interest
rates
Corporate News
Tata Steel plans $663 mn payout to settle pension dues
Post SBI merger, Modi pushes another banking coup
SAIL spends `64,562 cr on expansion projects
Govt to divest up to 10% stake in Nalco via OFS tomorrow, issue price set at
`67
Market Outlook
April 19, 2017
Quarterly Bloomberg Brokers Consensus Estimate
IndusInd Bank Ltd - Apr 19, 2017
Particulars ( ` cr)
4QFY17E
4QFY16
y-o-y (%)
3QFY17
q-o-q (%)
Net profit
784
620
26.4
751
4.5
Yes Bank Ltd - Apr 19, 2017
Particulars ( ` cr)
4QFY17E
4QFY16
y-o-y (%)
3QFY17
q-o-q (%)
Net profit
897
702
27.7
883
1.6
Hindustan Zinc Ltd - Apr 20, 2017
Particulars ( ` cr)
4QFY17E
4QFY16
y-o-y (%)
3QFY17
q-o-q (%)
Net sales
6,106
3,070
98.9
4,944
23.5
EBITDA
3,522
1,308
169.3
2,783
26.5
EBITDA margin (%)
57.7
42.6
56.3
Net profit
2,903
2,149
35.1
2,320
25.1
HDFC Bank Ltd - Apr 21, 2017
Particulars ( ` cr)
4QFY17E
4QFY16
y-o-y (%)
3QFY17
q-o-q (%)
Net profit
3,921
3,374
16.2
3,865
1.4
ACC Ltd - Apr 21, 2017
Particulars ( ` cr)
1QCY17E
1QCY16
y-o-y (%)
4QCY16
q-o-q (%)
Net sales
3,015
2,927
3.0
2,669
13.0
EBITDA
340
433
(21.4)
254
33.9
EBITDA margin (%)
11.3
14.8
9.5
Net profit
177
232
(23.9)
48
265.8
Market Outlook
April 19, 2017
Top Picks ★★★★★
Market Cap
CMP
Target
Upside
Company
Rationale
(` Cr)
(`)
(`)
(%)
Strong growth in domestic business due to its leadership in
Alkem Laboratories
24,953
2,087
2,257
8.1
acute therapeutic segment. Alkem expects to launch more
products in USA, which bodes for its international business.
We expect the company would report strong profitability
Asian Granito
1,132
376
405
7.7
owing to better product mix, higher B2C sales and
amalgamation synergy..
Among the top 4 players in the consumer durables segment.
Bajaj Electricals
3,500
346
395
14.3
Improved profitability backed by turn around in E&P segment.
Strong order book lends earnings visibility.
Favourable outlook for the AC industry to augur well for
Cooling products business which is out pacing the market
Blue Star
6,565
687
760
10.6
growth. EMPPAC division's profitability to improve once
operating environment turns around..
With a focus on the low and medium income (LMI) consumer
Dewan Housing Finance
12,355
395
460
16.6
segment, the company has increased its presence in tier-II &
III cities where the growth opportunity is immense.
Strong loan growth backed by diversified loan portfolio and
Equitas Holdings
5,554
164
235
42.9
adequate CAR. ROE & ROA likely to remain decent as risk of
dilution remains low. Attractive valuations considering growth.
Economic recovery to have favourable impact on advertising
& circulation revenue growth. Further, the acquisition of a
Jagran Prakashan
6,479
198
225
13.5
radio business (Radio City) would also boost the company's
revenue growth.
High order book execution in EPC segment, rising B2C sales
KEI Industries
1,528
196
207
5.4
and higher exports to boost the revenues and profitability
Speedier execution and speedier sales, strong revenue visibilty
Mahindra Lifespace
1,690
412
522
26.8
in short-to-long run, attractive valuations
Higher growth in domestic branded sales and healthy export
Mirza International
1,068
89
107
20.6
to boost the profitability.
Massive capacity expansion along with rail advantage at ICD
Navkar Corporation
2,884
202
265
31.1
as well CFS augurs well for the company
Strong brands and distribution network would boost growth
Siyaram Silk Mills
1,622
1,730
1,872
8.2
going ahead. Stock currently trades at an inexpensive
valuation.
Market leadership in Hindi news genre and no. 2 viewership
ranking in English news genre, exit from the radio business,
TV Today Network
1,637
275
344
25.3
and anticipated growth in ad spends by corporates to benefit
the stock.
Source: Company, Angel Research
Market Outlook
April 19, 2017
Key Upcoming Events
Result Calendar
Date
Company
Apr 19, 2017
IndusInd Bank, Yes Bank
Apr 20, 2017
Mindtree, Infotech Enterprises, Hind. Zinc
Apr 21, 2017
FAG Bearings, ACC
Apr 24, 2017
Rallis, UltraTech Cement, Hexaware
Apr 25, 2017
Wipro, Persistent
Apr 26, 2017
KPIT Cummins
Source: Bloomberg, Angel Research
Global economic events release calendar
Date
Time
Country
Event Description
Unit
Period
Bloomberg Data
Last Reported Estimated
Apr 19, 2017
6:45PM US
Industrial Production
%
Mar
0.11
0.50
Apr 20, 2017
6:00PM US
Initial Jobless claims
Thousands
Apr 15
234.00
240.00
1:00PM Germany
PMI Manufacturing
Value
Apr P
58.30
58.00
Apr 21, 2017
7:30PM Euro Zone
Euro-Zone Consumer Confidence
Value
Apr A
(5.00)
(4.80)
1:00PM Germany
PMI Services
Value
Apr P
55.60
55.50
7:30PM US
Existing home sales
Million
Mar
5.48
5.60
Apr 25, 2017
7:30PM US
Consumer Confidence
S.A./ 1985=100
Apr
125.60
124.00
7:30PM US
New home sales
Thousands
Mar
592.00
587.50
Apr 27, 2017
5:15PM Euro Zone
ECB announces interest rates
%
Apr 27
--
--
Apr 28, 2017
6:00PM US
GDP Qoq (Annualised)
% Change
1Q A
2.10
1.30
2:00PM UK
GDP (YoY)
% Change
1Q A
1.90
--
Apr 30, 2017
6:30AM China
PMI Manufacturing
Value
Apr
51.80
--
May 2,, 2017 2:00PM UK
PMI Manufacturing
Value
Apr
54.20
--
1:25PM Germany
Unemployment change (000's)
Thousands
Apr
(30.00)
--
May 3,, 2017 2:30PM Euro Zone
Euro-Zone GDP s.a. (QoQ)
% Change
1Q A
0.50
--
11:30PM US
FOMC rate decision
%
May 3
1.00
1.00
May 5,, 2017 6:00PM US
Change in Nonfarm payrolls
Thousands
Apr
98.00
--
6:00PM US
Unnemployment rate
%
Apr
4.50
--
May 8,, 2017
China
Exports YoY%
% Change
Apr
16.40
--
May 10, 2017 7:00AM China
Consumer Price Index (YoY)
% Change
Apr
0.90
--
India
Imports YoY%
% Change
Apr
45.30
--
India
Exports YoY%
% Change
Apr
27.60
--
May 11, 2017
US
Producer Price Index (mom)
% Change
Apr
(0.20)
--
2:00PM UK
Industrial Production (YoY)
% Change
Mar
2.80
--
5:30PM India
Industrial Production YoY
% Change
Mar
(1.20)
--
Source: Bloomberg, Angel Research
Market Outlook
April 19, 2017
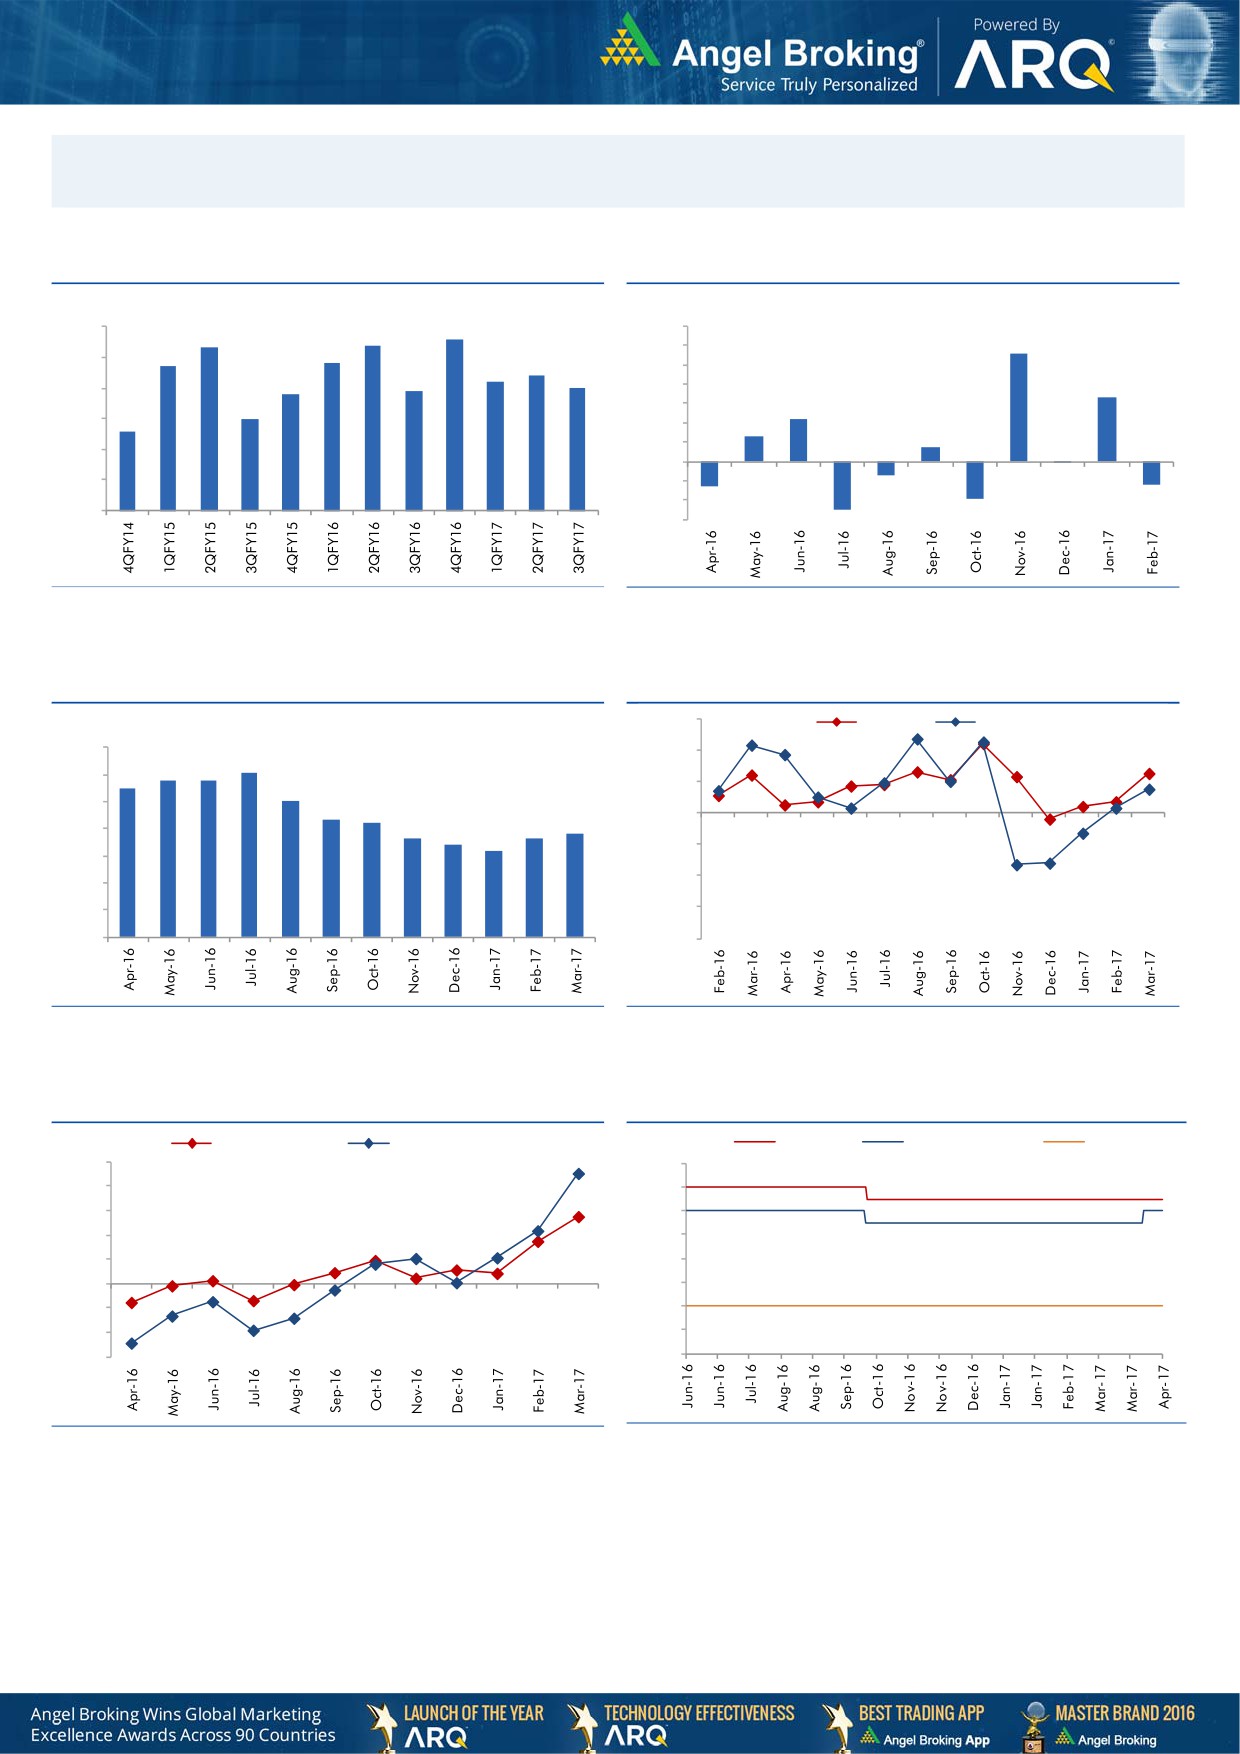
Macro watch
Exhibit 1: Quarterly GDP trends
Exhibit 2: IIP trends
(%)
(%)
8.6
9.0
8.3
8.4
7.0
5.6
7.7
7.8
6.0
8.0
7.4
7.2
5.0
6.9
7.0
6.8
4.0
3.3
7.0
6.0
3.0
2.2
6.0
5.6
1.3
2.0
0.7
1.0
5.0
-
4.0
(1.0)
(0.1)
(0.7)
(2.0)
(1.3)
(1.2)
3.0
(3.0)
(1.9)
(2.5)
Source: CSO, Angel Research
Source: MOSPI, Angel Research
Exhibit 3: Monthly CPI inflation trends
Exhibit 4: Manufacturing and services PMI
56.0
Mfg. PMI
Services PMI
(%)
7.0
54.0
6.1
5.8
5.8
6.0
5.5
5.1
52.0
5.0
4.3
4.2
3.8
50.0
3.6
3.7
4.0
3.4
3.2
48.0
3.0
46.0
2.0
1.0
44.0
-
42.0
Source: MOSPI, Angel Research
Source: Market, Angel Research; Note: Level above 50 indicates expansion
Exhibit 5: Exports and imports growth trends
Exhibit 6: Key policy rates
(%)
Exports yoy growth
Imports yoy growth
(%)
Repo rate
Reverse Repo rate
CRR
50.0
7.00
40.0
6.50
30.0
6.00
20.0
5.50
10.0
5.00
0.0
4.50
(10.0)
4.00
(20.0)
3.50
(30.0)
3.00
Source: Bloomberg, Angel Research
Source: RBI, Angel Research
Market Outlook
April 19, 2017
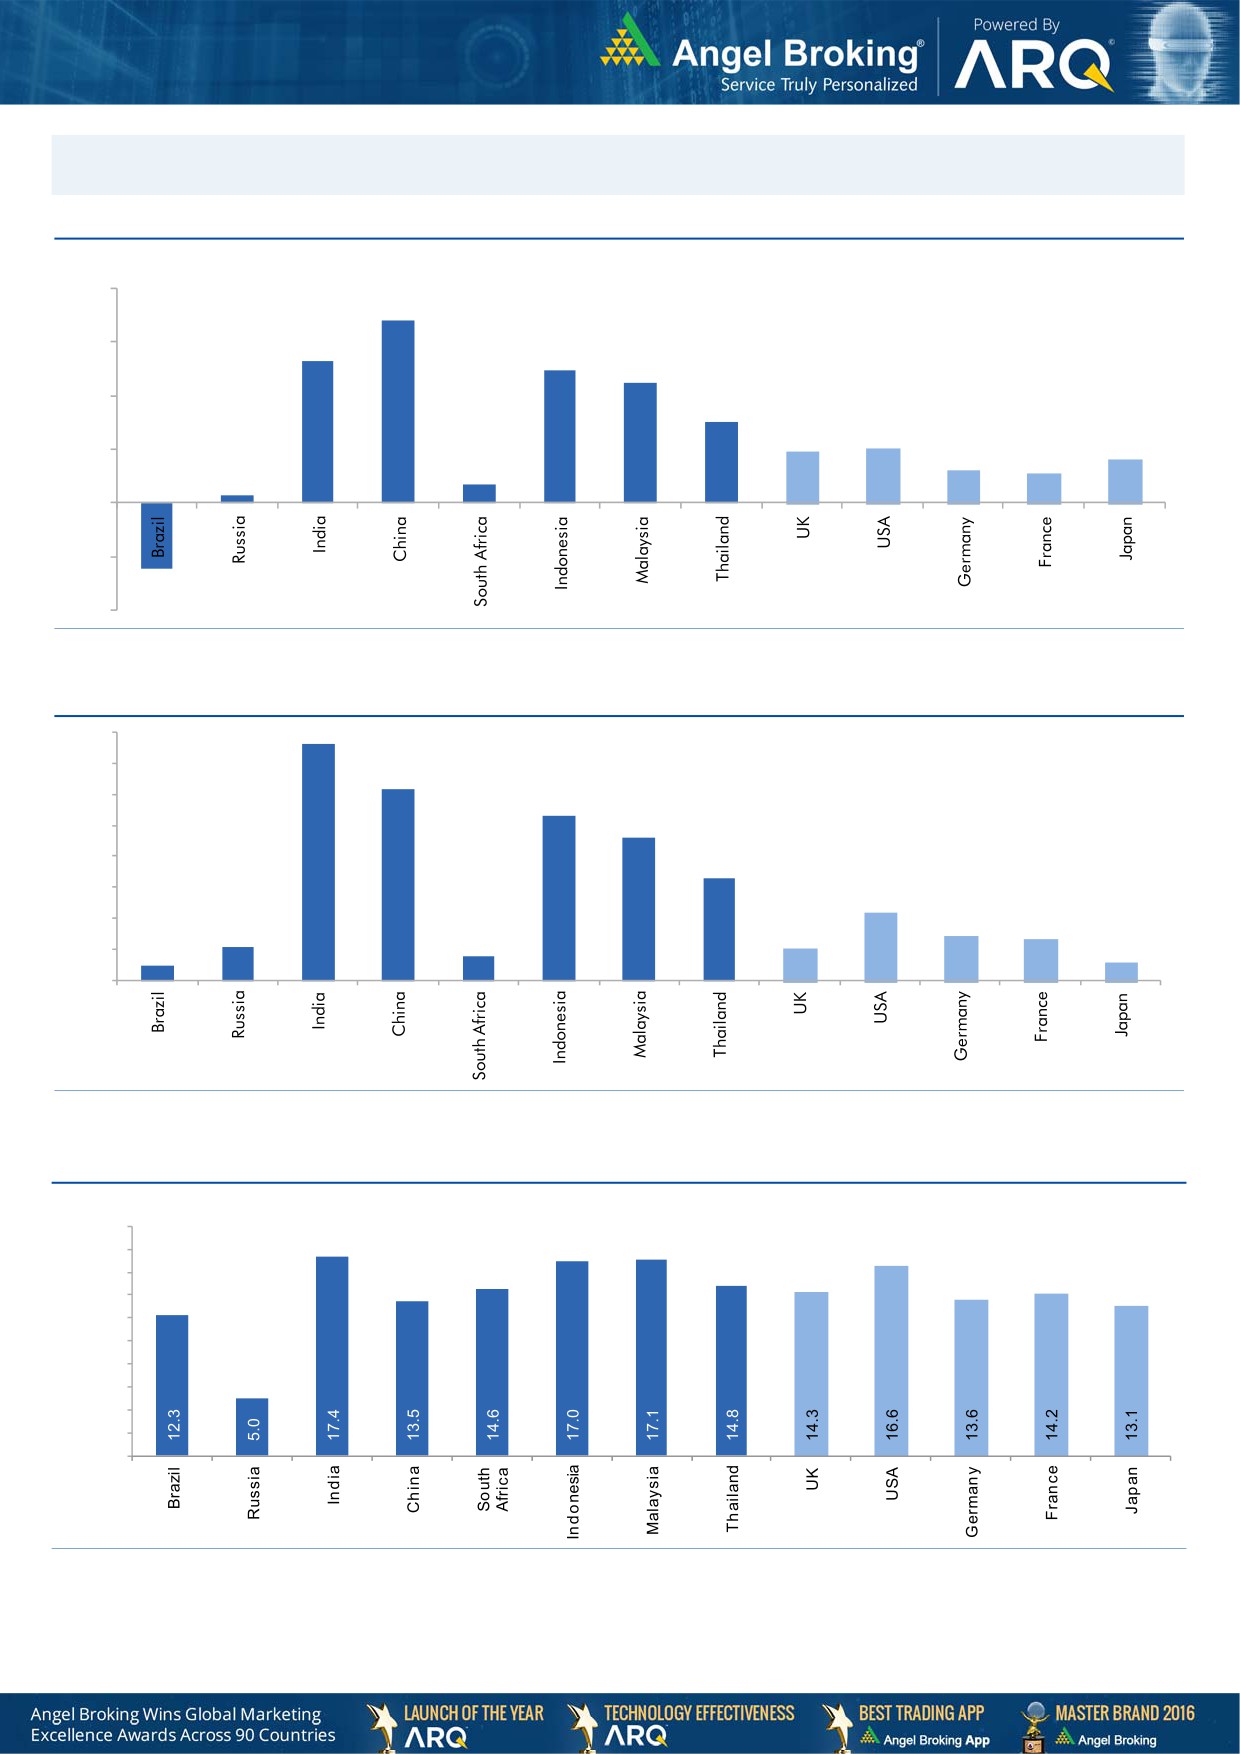
Global watch
Exhibit 1: Latest quarterly GDP Growth (%, yoy) across select developing and developed countries
(%)
8.0
6.8
6.0
5.3
4.9
0.7
4.5
4.0
3.0
1.9
2.0
2.0
0.3
1.6
1.2
1.1
-
(2.0)
(2.5)
(4.0)
Source: Bloomberg, Angel Research
Exhibit 2: 2016 GDP Growth projection by IMF (%, yoy) across select developing and developed countries
(%)
7.6
7.0
6.2
6.0
5.3
4.6
5.0
4.0
3.3
3.0
2.2
2.0
1.1
1.4
1.3
0.5
1.1
0.8
1.0
0.6
-
Source: IMF, Angel Research
Exhibit 3: One year forward P-E ratio across select developing and developed countries
(x)
20.0
18.0
16.0
14.0
12.0
10.0
8.0
6.0
4.0
2.0
-
Source: IMF, Angel Research
Market Outlook
April 19, 2017
Exhibit 4: Relative performance of indices across globe
Returns (%)
Country
Name of index
Closing price
1M
3M
1YR
Brazil
Bovespa
64,159
(2.9)
3.0
22.8
Russia
Micex
1,920
(5.7)
(12.2)
(2.0)
India
Nifty
9,105
0.2
8.6
18.7
China
Shanghai Composite
3,197
(1.4)
0.8
4.8
South Africa
Top 40
45,873
3.0
(0.1)
(1.2)
Mexico
Mexbol
48,763
4.1
6.7
7.1
Indonesia
LQ45
924
2.8
4.7
11.8
Malaysia
KLCI
1,741
(0.3)
4.1
1.5
Thailand
SET 50
998
2.1
1.9
10.9
USA
Dow Jones
20,523
(1.5)
3.8
14.6
UK
FTSE
7,148
(3.0)
(2.5)
11.5
Japan
Nikkei
18,419
(6.0)
(2.1)
16.4
Germany
DAX
12,000
0.2
4.1
16.9
France
CAC
4,990
0.5
2.6
9.9
Source: Bloomberg, Angel Research
Stock Watch
April 19, 2017
Company Name
Reco
CMP
Target
Mkt Cap
Sales ( Čcr )
OPM(%)
EPS (Č)
PER(x)
P/BV(x)
RoE(%)
EV/Sales(x)
(Č)
Price ( Č)
( Č cr )
FY17E
FY18E
FY17E
FY18E
FY17E
FY18E
FY17E
FY18E
FY17E
FY18E
FY17E
FY18E
FY17E
FY18E
Agri / Agri Chemical
Rallis
Neutral
247
-
4,808
1,937
2,164
13.3
14.3
9.0
11.0
27.5
22.5
4.8
4.2
18.4
19.8
2.5
2.2
United Phosphorus
Neutral
760
-
38,542
15,176
17,604
18.5
18.5
37.4
44.6
20.3
17.0
4.0
3.3
21.4
21.2
2.7
2.2
Auto & Auto Ancillary
Amara Raja Batteries
Buy
855
1,009
14,612
5,305
6,100
16.0
16.3
28.4
34.0
30.1
25.2
5.8
4.9
19.3
19.3
2.8
2.4
Apollo Tyres
Neutral
227
-
11,537
12,877
14,504
14.3
13.9
21.4
23.0
10.6
9.9
1.6
1.4
16.4
15.2
1.1
1.0
Ashok Leyland
Buy
82
111
23,222
20,021
21,915
11.6
11.9
4.5
5.3
18.1
15.3
3.7
3.3
20.6
21.5
1.1
1.0
Bajaj Auto
Neutral
2,823
-
81,675
25,093
27,891
19.5
19.2
143.9
162.5
19.6
17.4
5.5
4.7
30.3
29.4
3.0
2.6
Bharat Forge
Neutral
1,039
-
24,183
7,726
8,713
20.5
21.2
35.3
42.7
29.4
24.3
5.4
4.9
18.9
20.1
3.2
2.8
Ceat
Neutral
1,429
-
5,779
7,524
8,624
13.0
12.7
131.1
144.3
10.9
9.9
2.0
1.7
19.8
18.6
0.8
0.7
Eicher Motors
Neutral
25,533
-
69,475
16,583
20,447
17.5
18.0
598.0
745.2
42.7
34.3
14.6
11.1
41.2
38.3
4.0
3.2
Exide Industries
Neutral
225
-
19,142
7,439
8,307
15.0
15.0
8.1
9.3
27.8
24.2
3.9
3.5
14.3
16.7
2.2
2.0
Gabriel India
Accumulate
123
130
1,773
1,544
1,715
9.0
9.3
5.4
6.3
22.9
19.6
4.3
3.8
18.9
19.5
1.1
1.0
Hero Motocorp
Accumulate
3,224
3,446
64,381
28,083
30,096
15.3
15.7
171.8
187.0
18.8
17.2
6.6
5.5
30.1
27.9
2.1
1.9
Indag Rubber
Neutral
202
-
530
286
326
19.8
16.8
11.7
13.3
17.3
15.1
2.9
2.7
17.8
17.1
1.5
1.3
Jamna Auto Industries
Neutral
232
-
1,852
1,486
1,620
9.8
9.9
15.0
17.2
15.5
13.5
3.4
2.9
21.8
21.3
1.3
1.2
JK Tyres
Neutral
139
-
3,152
7,455
8,056
15.0
15.0
21.8
24.5
6.4
5.7
1.3
1.1
22.8
21.3
0.6
0.5
L G Balakrishnan & Bros Neutral
623
-
978
1,302
1,432
11.6
11.9
43.7
53.0
14.3
11.8
2.0
1.8
13.8
14.2
0.8
0.8
Mahindra and Mahindra Neutral
1,263
-
78,428
46,534
53,077
11.6
11.7
67.3
78.1
18.8
16.2
3.1
2.7
15.4
15.8
1.7
1.4
Maruti
Accumulate
6,138
6,560
185,406
67,822
83,288
16.0
16.4
253.8
312.4
24.2
19.7
5.6
4.5
23.0
22.9
2.4
1.9
Minda Industries
Neutral
438
-
3,475
2,728
3,042
9.0
9.1
68.2
86.2
6.4
5.1
1.5
1.2
23.8
24.3
1.3
1.2
Motherson Sumi
Neutral
372
-
52,185
45,896
53,687
7.8
8.3
13.0
16.1
28.5
23.1
9.2
7.3
34.7
35.4
1.2
1.0
Rane Brake Lining
Neutral
1,022
-
809
511
562
11.3
11.5
28.1
30.9
36.4
33.1
5.6
5.0
15.3
15.0
1.7
1.6
Setco Automotive
Neutral
41
-
543
741
837
13.0
13.0
15.2
17.0
2.7
2.4
0.4
0.4
15.8
16.3
1.1
1.0
Subros
Neutral
229
-
1,371
1,488
1,681
11.7
11.9
6.4
7.2
35.7
31.9
3.8
3.4
10.8
11.4
1.2
1.0
Swaraj Engines
Neutral
1,490
-
1,851
660
810
15.2
16.4
54.5
72.8
27.3
20.5
8.5
7.7
31.5
39.2
2.6
2.1
Tata Motors
Neutral
444
-
128,227
300,209
338,549
8.9
8.4
42.7
54.3
10.4
8.2
1.7
1.4
15.6
17.2
0.5
0.5
TVS Motor
Neutral
469
-
22,274
13,390
15,948
6.9
7.1
12.8
16.5
36.7
28.3
9.1
7.2
26.3
27.2
1.7
1.4
Capital Goods
ACE
Neutral
63
-
626
709
814
4.1
4.6
1.4
2.1
45.2
30.1
1.9
1.8
4.4
6.0
1.0
0.9
BEML
Neutral
1,354
-
5,639
3,451
4,055
6.3
9.2
31.4
57.9
43.1
23.4
2.6
2.4
6.3
10.9
1.8
1.5
BGR Energy
Neutral
165
-
1,191
16,567
33,848
6.0
5.6
7.8
5.9
21.2
28.0
1.2
1.2
4.7
4.2
0.2
0.1
Stock Watch
April 19, 2017
Company Name
Reco
CMP
Target
Mkt Cap
Sales ( Čcr )
OPM(%)
EPS (Č)
PER(x)
P/BV(x)
RoE(%)
EV/Sales(x)
(Č)
Price ( Č)
( Č cr )
FY17E
FY18E
FY17E
FY18E
FY17E
FY18E
FY17E
FY18E
FY17E
FY18E
FY17E
FY18E
FY17E
FY18E
Capital Goods
Bharat Electronics
Neutral
172
-
38,396
8,137
9,169
16.8
17.2
58.7
62.5
2.9
2.8
0.5
0.4
44.6
46.3
3.7
3.3
BHEL
Neutral
170
-
41,646
28,797
34,742
-
2.8
2.3
6.9
74.0
24.7
1.3
1.2
1.3
4.8
1.1
0.8
Blue Star
Accumulate
687
760
6,565
4,283
5,077
5.9
7.3
14.9
22.1
46.2
31.0
9.0
7.6
20.4
26.4
1.6
1.3
CG Power and Industrial
Neutral
79
-
4,926
5,777
6,120
5.9
7.0
3.3
4.5
23.8
17.5
1.1
1.0
4.4
5.9
0.8
0.7
Solutions
Greaves Cotton
Neutral
165
-
4,034
1,755
1,881
16.8
16.9
7.8
8.5
21.2
19.4
4.2
3.9
20.6
20.9
2.0
1.8
Inox Wind
Neutral
185
-
4,112
5,605
6,267
15.7
16.4
24.8
30.0
7.5
6.2
2.1
1.5
25.9
24.4
0.8
0.6
KEC International
Neutral
215
-
5,535
9,294
10,186
7.9
8.1
9.9
11.9
21.8
18.1
3.2
2.8
15.6
16.3
0.8
0.8
KEI Industries
Accumulate
196
207
1,528
2,682
3,058
10.4
10.0
11.7
12.8
16.7
15.3
3.4
2.8
20.1
18.2
0.8
0.7
Thermax
Neutral
994
-
11,847
5,421
5,940
7.3
7.3
25.7
30.2
38.7
32.9
4.7
4.3
12.2
13.1
2.1
1.9
VATech Wabag
Neutral
665
-
3,627
3,136
3,845
8.9
9.1
26.0
35.9
25.6
18.5
3.2
2.7
13.4
15.9
1.1
0.8
Voltas
Neutral
408
-
13,500
6,511
7,514
7.9
8.7
12.9
16.3
31.6
25.0
5.7
5.0
16.7
18.5
1.8
1.6
Cement
ACC
Neutral
1,493
-
28,040
11,225
13,172
13.2
16.9
44.5
75.5
33.6
19.8
3.2
2.9
11.2
14.2
2.5
2.1
Ambuja Cements
Neutral
241
-
47,864
9,350
10,979
18.2
22.5
5.8
9.5
41.6
25.4
3.5
3.1
10.2
12.5
5.1
4.4
India Cements
Neutral
161
-
4,935
4,364
4,997
18.5
19.2
7.9
11.3
20.3
14.2
1.5
1.4
8.0
8.5
1.9
1.7
J K Lakshmi Cement
Neutral
453
-
5,326
2,913
3,412
14.5
19.5
7.5
22.5
60.4
20.1
3.7
3.1
12.5
18.0
2.4
2.0
JK Cement
Neutral
924
-
6,462
4,398
5,173
15.5
17.5
31.2
55.5
29.6
16.7
3.6
3.1
12.0
15.5
2.0
1.7
Orient Cement
Neutral
146
-
2,993
2,114
2,558
18.5
20.5
8.1
11.3
18.0
12.9
2.7
2.3
9.0
14.0
2.0
1.6
UltraTech Cement
Neutral
3,971
-
108,997
25,768
30,385
21.0
23.5
111.0
160.0
35.8
24.8
4.6
4.0
13.5
15.8
4.3
3.6
Construction
Engineers India
Neutral
161
-
10,816
1,725
1,935
16.0
19.1
11.4
13.9
14.1
11.6
1.9
1.9
13.4
15.3
5.2
4.7
Gujarat Pipavav Port
Neutral
162
-
7,837
705
788
52.2
51.7
5.0
5.6
32.4
29.0
3.2
2.9
11.2
11.2
10.8
9.1
ITNL
Neutral
111
-
3,637
8,946
10,017
31.0
31.6
8.1
9.1
13.7
12.2
0.5
0.5
4.2
5.0
3.7
3.5
KNR Constructions
Neutral
202
-
2,846
1,385
1,673
14.7
14.0
41.2
48.5
4.9
4.2
0.9
0.8
14.9
15.2
2.1
1.8
Larsen & Toubro
Neutral
1,671
-
155,964
111,017
124,908
11.0
11.0
61.1
66.7
27.4
25.0
3.3
3.0
13.1
12.9
2.4
2.2
MEP Infra
Neutral
64
-
1,043
1,877
1,943
30.6
29.8
3.0
4.2
21.4
15.3
10.4
7.0
0.6
0.6
1.9
1.8
Nagarjuna Const.
Neutral
92
-
5,123
8,842
9,775
9.1
8.8
5.3
6.4
17.4
14.4
1.4
1.3
8.2
9.1
0.7
0.6
NBCC
Neutral
181
-
16,299
7,428
9,549
7.9
8.6
8.2
11.0
22.1
16.5
1.1
0.9
28.2
28.7
1.9
1.4
PNC Infratech
Neutral
137
-
3,511
2,350
2,904
13.1
13.2
9.0
8.8
15.2
15.6
0.6
0.5
15.9
13.9
1.6
1.3
Power Mech Projects
Neutral
533
-
784
1,801
2,219
12.7
14.6
72.1
113.9
7.4
4.7
1.4
1.2
16.8
11.9
0.4
0.3
Sadbhav Engineering
Neutral
315
-
5,401
3,598
4,140
10.3
10.6
9.0
11.9
35.0
26.5
3.7
3.2
9.9
11.9
1.8
1.5
Stock Watch
April 19, 2017
Company Name
Reco
CMP
Target
Mkt Cap
Sales ( Čcr )
OPM(%)
EPS (Č)
PER(x)
P/BV(x)
RoE(%)
EV/Sales(x)
(Č)
Price ( Č)
( Č cr )
FY17E
FY18E
FY17E
FY18E
FY17E
FY18E
FY17E
FY18E
FY17E
FY18E
FY17E
FY18E
FY17E
FY18E
Construction
Simplex Infra
Neutral
372
-
1,840
6,829
7,954
10.5
10.5
31.4
37.4
11.9
10.0
1.2
1.1
9.9
13.4
0.7
0.6
SIPL
Neutral
104
-
3,653
1,036
1,252
65.5
66.2
(8.4)
(5.6)
3.9
4.4
(22.8)
(15.9)
11.7
9.8
Financials
Axis Bank
Buy
498
580
119,273
46,932
53,575
3.5
3.4
32.4
44.6
15.4
11.2
2.0
1.7
13.6
16.5
-
-
Bank of Baroda
Neutral
176
-
40,542
19,980
23,178
1.8
1.8
11.5
17.3
15.3
10.2
1.8
1.4
8.3
10.1
-
-
Can Fin Homes
Neutral
2,438
-
6,489
420
526
3.5
3.5
86.5
107.8
28.2
22.6
6.1
5.0
23.6
24.1
-
-
Canara Bank
Neutral
312
-
16,952
15,225
16,836
1.8
1.8
14.5
28.0
21.5
11.2
1.5
1.2
5.8
8.5
-
-
Cholamandalam Inv. &
Buy
1,049
1,230
16,389
2,012
2,317
6.3
6.3
42.7
53.6
24.6
19.6
3.9
3.3
16.9
18.3
-
-
Fin. Co.
Dewan Housing Finance Buy
395
460
12,355
2,225
2,688
2.9
2.9
29.7
34.6
13.3
11.4
2.1
1.4
16.1
14.8
-
-
Equitas Holdings
Buy
164
235
5,554
939
1,281
11.7
11.5
5.8
8.2
28.3
20.1
2.4
2.2
10.9
11.5
-
-
Federal Bank
Neutral
92
-
15,826
8,259
8,995
3.0
3.0
4.3
5.6
21.4
16.4
1.8
1.7
8.5
10.1
-
-
HDFC
Neutral
1,480
-
235,091
11,475
13,450
3.4
3.4
45.3
52.5
32.7
28.2
6.3
5.6
20.2
20.5
-
-
HDFC Bank
Neutral
1,446
-
370,480
46,097
55,433
4.5
4.5
58.4
68.0
24.8
21.3
4.3
3.6
18.8
18.6
-
-
ICICI Bank
Accumulate
283
315
164,851
42,800
44,686
3.1
3.3
18.0
21.9
15.7
12.9
2.1
2.0
11.1
12.3
-
-
Karur Vysya Bank
Buy
118
140
7,128
5,640
6,030
3.3
3.2
8.9
10.0
13.3
11.8
1.4
1.3
11.2
11.4
-
-
Lakshmi Vilas Bank
Neutral
170
-
3,262
3,339
3,799
2.7
2.8
11.0
14.0
15.5
12.2
1.6
1.5
11.2
12.7
-
-
LIC Housing Finance
Neutral
642
-
32,415
3,712
4,293
2.6
2.5
39.0
46.0
16.5
14.0
3.1
2.6
19.9
20.1
-
-
Punjab Natl.Bank
Neutral
156
-
33,218
23,532
23,595
2.3
2.4
6.8
12.6
23.0
12.4
3.6
2.5
3.3
6.5
-
-
RBL Bank
Neutral
551
-
20,375
1,783
2,309
2.6
2.6
12.7
16.4
43.4
33.6
4.7
4.2
12.8
13.3
-
-
Repco Home Finance
Accumulate
755
825
4,721
388
457
4.5
4.2
30.0
38.0
25.2
19.9
4.2
3.5
18.0
19.2
-
-
South Ind.Bank
Neutral
22
-
4,038
6,435
7,578
2.5
2.5
2.7
3.1
8.3
7.2
1.1
0.9
10.1
11.2
-
-
St Bk of India
Neutral
290
-
235,308
88,650
98,335
2.6
2.6
13.5
18.8
21.5
15.4
2.0
1.8
7.0
8.5
-
-
Union Bank
Neutral
153
-
10,508
13,450
14,925
2.3
2.3
25.5
34.5
6.0
4.4
0.9
0.8
7.5
10.2
-
-
Yes Bank
Neutral
1,606
-
73,307
8,978
11,281
3.3
3.4
74.0
90.0
21.7
17.8
4.1
3.5
17.0
17.2
-
-
FMCG
Akzo Nobel India
Neutral
1,911
-
9,166
2,955
3,309
13.3
13.7
57.2
69.3
33.4
27.6
10.9
9.2
32.7
33.3
2.9
2.6
Asian Paints
Neutral
1,041
-
99,848
17,128
18,978
16.8
16.4
19.1
20.7
54.5
50.3
19.0
17.9
34.8
35.5
5.7
5.2
Britannia
Accumulate
3,374
3,626
40,484
9,594
11,011
14.6
14.9
80.3
94.0
42.0
35.9
17.3
13.3
41.2
-
4.1
3.5
Colgate
Neutral
990
-
26,933
4,605
5,149
23.4
23.4
23.8
26.9
41.6
36.8
23.0
18.0
64.8
66.8
5.8
5.1
Dabur India
Accumulate
289
304
50,864
8,315
9,405
19.8
20.7
8.1
9.2
35.7
31.4
9.9
8.2
31.6
31.0
5.8
5.1
GlaxoSmith Con*
Neutral
5,198
-
21,861
4,350
4,823
21.2
21.4
179.2
196.5
29.0
26.5
7.7
6.5
27.1
26.8
4.4
3.9
Stock Watch
April 19, 2017
Company Name
Reco
CMP
Target
Mkt Cap
Sales ( Čcr )
OPM(%)
EPS (Č)
PER(x)
P/BV(x)
RoE(%)
EV/Sales(x)
(Č)
Price ( Č)
( Č cr )
FY17E FY18E
FY17E
FY18E
FY17E
FY18E
FY17E
FY18E
FY17E
FY18E
FY17E
FY18E
FY17E
FY18E
FMCG
Godrej Consumer
Neutral
1,651
-
56,240
10,235
11,428
18.4
18.6
41.1
44.2
40.2
37.4
8.9
7.5
24.9
24.8
5.6
4.9
HUL
Neutral
913
-
197,627
35,252
38,495
17.8
17.8
20.7
22.4
44.2
40.8
42.3
36.3
95.6
88.9
5.4
5.0
ITC
Neutral
279
-
338,851
40,059
44,439
38.3
39.2
9.0
10.1
31.1
27.5
8.7
7.6
27.8
27.5
8.0
7.2
Marico
Neutral
299
-
38,540
6,430
7,349
18.8
19.5
6.4
7.7
46.7
38.8
14.1
11.9
33.2
32.5
5.8
5.0
Nestle*
Neutral
6,328
-
61,016
10,073
11,807
20.7
21.5
124.8
154.2
50.7
41.0
20.8
18.7
34.8
36.7
5.9
5.0
Procter & Gamble
Neutral
7,329
-
23,790
2,939
3,342
23.2
23.0
146.2
163.7
50.1
44.8
12.7
10.5
25.3
23.5
7.6
6.6
Hygiene
Tata Global
Neutral
148
-
9,350
8,675
9,088
9.8
9.8
7.4
8.2
20.0
18.1
1.6
1.5
7.9
8.1
1.0
0.9
IT
HCL Tech^
Buy
808
1,000
115,305
49,242
57,168
20.5
20.5
55.7
64.1
14.5
12.6
3.0
2.3
20.3
17.9
2.2
1.8
Infosys
Buy
922
1,249
211,870
68,350
77,326
27.0
27.0
62.5
69.4
14.8
13.3
3.2
2.9
21.3
21.6
2.5
2.2
TCS
Buy
2,309
2,700
454,903
119,025
133,308
27.6
27.6
131.2
145.5
17.6
15.9
5.7
5.3
32.4
33.1
3.6
3.2
Tech Mahindra
Buy
418
600
40,756
29,673
32,937
15.5
17.0
32.8
39.9
12.8
10.5
2.5
2.2
19.6
20.7
1.1
0.9
Wipro
Buy
494
583
120,099
55,440
60,430
18.1
18.1
36.1
38.9
13.7
12.7
2.5
2.3
19.0
17.6
1.9
1.7
Media
D B Corp
Neutral
379
-
6,962
2,297
2,590
27.4
28.2
21.0
23.4
18.0
16.2
4.2
3.6
23.7
23.1
2.8
2.4
Hindustan Media
Neutral
291
-
2,134
1,016
1,138
24.3
25.2
27.3
30.1
10.7
9.7
2.0
1.8
16.2
15.8
1.4
1.2
Ventures
HT Media
Neutral
84
-
1,964
2,693
2,991
12.6
12.9
7.9
9.0
10.7
9.4
0.9
0.8
7.8
8.3
0.3
0.2
Jagran Prakashan
Accumulate
198
225
6,479
2,355
2,635
28.0
28.0
10.8
12.5
18.4
15.9
4.0
3.4
21.7
21.7
2.8
2.4
Sun TV Network
Neutral
799
-
31,497
2,850
3,265
70.1
71.0
26.2
30.4
30.5
26.3
7.8
6.9
24.3
25.6
10.6
9.2
TV Today Network
Buy
275
344
1,637
567
645
26.7
27.0
15.4
18.1
17.9
15.2
2.7
2.3
14.9
15.2
2.5
2.1
Metals & Mining
Coal India
Neutral
279
-
173,249
84,638
94,297
21.4
22.3
24.5
27.1
11.4
10.3
4.7
4.5
42.6
46.0
1.6
1.4
Hind. Zinc
Neutral
273
-
115,457
14,252
18,465
55.9
48.3
15.8
21.5
17.3
12.7
2.8
2.5
17.0
20.7
8.1
6.3
Hindalco
Neutral
184
-
41,220
107,899
112,095
7.4
8.2
9.2
13.0
20.0
14.1
1.0
0.9
4.8
6.6
0.9
0.8
JSW Steel
Neutral
187
-
45,262
53,201
58,779
16.1
16.2
130.6
153.7
1.4
1.2
0.2
0.2
14.0
14.4
1.6
1.4
NMDC
Neutral
127
-
40,102
6,643
7,284
44.4
47.7
7.1
7.7
17.9
16.5
1.6
1.5
8.8
9.2
3.8
3.4
SAIL
Neutral
60
-
24,904
47,528
53,738
(0.7)
2.1
(1.9)
2.6
23.2
0.7
0.6
(1.6)
3.9
1.4
1.2
Tata Steel
Neutral
450
-
43,729
121,374
121,856
7.2
8.4
18.6
34.3
24.2
13.1
1.5
1.4
6.1
10.1
1.0
1.0
Vedanta
Neutral
230
-
68,247
71,744
81,944
19.2
21.7
13.4
20.1
17.2
11.5
1.5
1.3
8.4
11.3
1.3
1.0
Oil & Gas
Cairn India
Neutral
282
-
52,966
9,127
10,632
4.3
20.6
8.8
11.7
32.1
24.1
1.0
1.0
3.3
4.2
7.3
6.1
GAIL
Neutral
394
-
66,663
56,220
65,198
9.3
10.1
27.1
33.3
14.5
11.8
1.3
1.2
9.3
10.7
1.4
1.2
Indian Oil Corp
Neutral
431
-
209,217
373,359
428,656
5.9
5.5
54.0
59.3
8.0
7.3
1.2
1.1
16.0
15.6
0.7
0.6
Stock Watch
April 19, 2017
Company Name
Reco
CMP
Target
Mkt Cap
Sales ( Čcr )
OPM(%)
EPS (Č)
PER(x)
P/BV(x)
RoE(%)
EV/Sales(x)
(Č)
Price ( Č)
( Č cr )
FY17E FY18E
FY17E
FY18E
FY17E
FY18E
FY17E
FY18E
FY17E
FY18E
FY17E
FY18E
FY17E
FY18E
Oil & Gas
ONGC
Neutral
181
-
232,346
137,222
152,563
15.0
21.8
19.5
24.1
9.3
7.5
0.8
0.8
8.5
10.1
2.0
1.8
Reliance Industries
Neutral
1,370
-
445,571
301,963
358,039
12.1
12.6
87.7
101.7
15.6
13.5
1.6
1.5
10.7
11.3
2.0
1.6
Pharmaceuticals
Alembic Pharma
Accumulate
610
689
11,499
3,483
4,244
20.2
21.4
24.3
33.6
25.1
18.2
5.7
4.6
25.5
25.3
3.2
2.6
Alkem Laboratories Ltd
Accumulate
2,087
2,257
24,953
6,065
7,009
18.7
20.0
80.2
92.0
26.0
22.7
5.8
4.9
22.5
21.6
4.1
3.5
Aurobindo Pharma
Buy
664
877
38,879
15,720
18,078
23.7
23.7
41.4
47.3
16.0
14.0
4.2
3.3
29.6
26.1
2.7
2.3
Aventis*
Neutral
4,542
-
10,461
2,277
2,597
16.6
17.4
128.9
157.0
35.2
28.9
6.0
4.6
21.6
26.4
4.4
3.6
Cadila Healthcare
Neutral
443
-
45,316
10,429
12,318
17.7
21.6
13.1
19.2
33.8
23.1
7.1
5.6
22.8
27.1
4.4
3.6
Cipla
Sell
575
465
46,235
15,378
18,089
15.7
16.8
19.3
24.5
29.8
23.5
3.5
3.1
12.3
13.9
3.2
2.7
Dishman Pharma
Sell
325
143
5,246
1,718
1,890
22.7
22.8
9.5
11.3
34.2
28.8
3.3
3.0
10.1
10.9
3.5
3.1
Dr Reddy's
Neutral
2,631
-
43,581
16,043
18,119
18.0
23.0
78.6
130.9
33.5
20.1
3.3
2.9
10.1
15.2
2.5
2.4
GSK Pharma*
Neutral
2,641
-
22,368
2,800
3,290
10.2
20.6
32.2
60.3
82.0
43.8
15.2
15.0
17.2
34.5
7.8
6.7
Indoco Remedies
Neutral
244
-
2,246
1,112
1,289
16.2
18.2
11.6
16.0
21.0
15.2
3.4
2.8
17.0
20.1
2.1
1.8
Ipca labs
Neutral
609
-
7,682
3,258
3,747
12.8
15.3
12.1
19.2
50.3
31.7
3.1
2.9
6.4
9.5
2.5
2.2
Lupin
Buy
1,416
1,809
63,921
15,912
18,644
26.4
26.7
58.1
69.3
24.4
20.4
4.7
3.9
21.4
20.9
4.1
3.4
Sun Pharma
Buy
665
847
159,621
31,129
35,258
32.0
32.9
30.2
35.3
22.0
18.9
3.6
3.0
20.0
20.1
4.7
4.0
Power
NTPC
Neutral
162
-
133,329
86,605
95,545
17.5
20.8
11.8
13.4
13.7
12.1
1.4
1.3
10.5
11.1
2.9
2.9
Power Grid
Accumulate
202
223
105,861
25,315
29,193
88.2
88.7
14.2
17.2
14.3
11.8
2.2
1.9
15.2
16.1
8.8
7.9
Tata Power
Neutral
84
-
22,598
36,916
39,557
17.4
27.1
5.1
6.3
16.4
13.3
1.4
1.3
9.0
10.3
1.6
1.5
Real Estate
MLIFE
Buy
412
522
1,690
1,152
1,300
22.7
24.6
29.9
35.8
13.8
11.5
1.0
1.0
7.6
8.6
2.2
1.8
Prestige Estate
Neutral
244
-
9,154
4,707
5,105
25.2
26.0
10.3
13.0
23.7
18.8
1.9
1.8
10.3
10.2
3.1
2.8
Telecom
Bharti Airtel
Neutral
339
-
135,332
105,086
114,808
34.5
34.7
12.2
16.4
27.8
20.6
1.9
1.8
6.8
8.4
2.2
1.9
Idea Cellular
Neutral
86
-
30,988
40,133
43,731
37.2
37.1
6.4
6.5
13.4
13.2
1.1
1.0
8.2
7.6
1.8
1.5
zOthers
Abbott India
Neutral
4,684
-
9,954
3,153
3,583
14.1
14.4
152.2
182.7
30.8
25.6
151.1
129.1
25.6
26.1
2.9
2.5
Asian Granito
Accumulate
376
405
1,132
1,060
1,169
12.2
12.5
12.7
15.9
29.7
23.7
2.8
2.5
9.5
10.7
1.4
1.2
Bajaj Electricals
Accumulate
346
395
3,500
4,801
5,351
5.7
6.2
10.4
13.7
33.2
25.3
4.1
3.7
12.4
14.5
0.7
0.7
Banco Products (India)
Neutral
218
-
1,556
1,353
1,471
12.3
12.4
14.5
16.3
15.0
13.3
20.7
18.7
14.5
14.6
1.1
117.1
Coffee Day Enterprises
Neutral
248
-
5,100
2,964
3,260
20.5
21.2
4.7
8.0
-
30.9
2.9
2.6
5.5
8.5
2.1
1.9
Ltd
Competent Automobiles Neutral
227
-
140
1,137
1,256
3.1
2.7
28.0
23.6
8.1
9.6
43.7
39.5
14.3
11.5
0.1
0.1
Elecon Engineering
Neutral
61
-
679
1,482
1,660
13.7
14.5
3.9
5.8
15.5
10.4
3.7
3.4
7.8
10.9
0.8
0.7
Stock Watch
April 19, 2017
Company Name
Reco
CMP
Target
Mkt Cap
Sales ( Čcr )
OPM(%)
EPS (Č)
PER(x)
P/BV(x)
RoE(%)
EV/Sales(x)
(Č)
Price ( Č)
( Č cr )
FY17E
FY18E
FY17E
FY18E
FY17E
FY18E
FY17E
FY18E
FY17E
FY18E
FY17E
FY18E
FY17E
FY18E
zOthers
Finolex Cables
Neutral
544
-
8,320
2,883
3,115
12.0
12.1
14.2
18.6
38.3
29.3
20.4
17.8
15.8
14.6
2.6
2.3
Garware Wall Ropes
Neutral
755
-
1,653
863
928
15.1
15.2
36.4
39.4
20.8
19.2
3.8
3.2
17.5
15.9
1.8
1.7
Goodyear India*
Neutral
879
-
2,027
1,598
1,704
10.4
10.2
49.4
52.6
17.8
16.7
82.1
72.0
18.2
17.0
1.0
135.9
Hitachi
Neutral
1,813
-
4,930
2,081
2,433
8.8
8.9
33.4
39.9
54.3
45.4
43.8
36.5
22.1
21.4
2.4
2.0
HSIL
Neutral
340
-
2,457
2,384
2,515
15.8
16.3
15.3
19.4
22.2
17.5
22.1
19.0
7.8
9.3
1.2
1.1
Interglobe Aviation
Neutral
1,077
-
38,923
21,122
26,005
14.5
27.6
110.7
132.1
9.7
8.2
58.2
41.6
168.5
201.1
1.8
1.4
Jyothy Laboratories
Neutral
391
-
7,106
1,440
2,052
11.5
13.0
8.5
10.0
46.0
39.1
11.1
10.3
18.6
19.3
5.2
3.6
Kirloskar Engines India
Neutral
395
-
5,717
2,554
2,800
9.9
10.0
10.5
12.1
37.7
32.7
15.8
14.9
10.7
11.7
1.9
1.7
Ltd
Linc Pen & Plastics
Neutral
288
-
426
382
420
9.3
9.5
13.5
15.7
21.4
18.3
3.7
3.2
17.1
17.3
1.2
1.1
M M Forgings
Neutral
601
-
725
546
608
20.4
20.7
41.3
48.7
14.6
12.3
82.3
72.8
16.6
17.0
1.2
1.1
Manpasand Bever.
Neutral
714
-
4,088
836
1,087
19.6
19.4
16.9
23.8
42.3
30.0
5.1
4.4
12.0
14.8
4.6
3.5
Mirza International
Buy
89
107
1,068
963
1,069
17.2
18.0
6.1
7.5
14.5
11.8
2.2
1.9
15.0
15.7
1.3
1.2
MT Educare
Neutral
80
-
320
366
417
17.7
18.2
9.4
10.8
8.6
7.4
1.9
1.7
22.2
22.3
0.8
0.7
Narayana Hrudaya
Neutral
319
-
6,523
1,873
2,166
11.5
11.7
2.6
4.0
120.7
80.5
7.4
6.7
6.1
8.3
3.6
3.1
Navkar Corporation
Buy
202
265
2,884
369
561
42.9
42.3
6.9
11.5
29.3
17.6
2.1
1.8
7.4
10.5
8.8
5.8
Navneet Education
Neutral
168
-
3,914
1,062
1,147
24.0
24.0
6.1
6.6
27.5
25.3
5.7
5.0
20.6
19.8
3.8
3.5
Nilkamal
Neutral
1,949
-
2,909
1,995
2,165
10.7
10.4
69.8
80.6
27.9
24.2
111.4
96.8
16.6
16.5
1.5
1.3
Page Industries
Neutral
13,784
-
15,374
2,450
3,124
20.1
17.6
299.0
310.0
46.1
44.5
307.0
234.3
47.1
87.5
6.3
5.0
Parag Milk Foods
Neutral
244
-
2,055
1,919
2,231
9.3
9.6
9.5
12.9
25.9
18.9
4.0
3.3
15.5
17.5
1.2
1.0
Quick Heal
Neutral
247
-
1,728
408
495
27.3
27.0
7.7
8.8
31.8
28.0
3.0
3.0
9.3
10.6
3.4
2.8
Radico Khaitan
Buy
109
147
1,451
1,667
1,824
13.0
13.2
6.7
8.2
16.4
13.3
1.5
1.4
9.0
10.2
1.3
1.1
Relaxo Footwears
Neutral
490
-
5,886
2,085
2,469
9.2
8.2
7.6
8.0
64.8
61.7
25.1
21.5
17.9
18.8
2.9
2.5
S H Kelkar & Co.
Neutral
312
-
4,506
1,036
1,160
15.1
15.0
6.1
7.2
51.0
43.4
5.5
5.0
10.7
11.5
4.2
3.7
Siyaram Silk Mills
Accumulate
1,730
1,872
1,622
1,652
1,857
11.6
11.7
92.4
110.1
18.7
15.7
2.8
2.4
14.7
15.2
1.2
1.1
Styrolution ABS India*
Neutral
738
-
1,299
1,440
1,537
9.2
9.0
40.6
42.6
18.2
17.3
46.4
42.2
12.3
11.6
0.9
0.8
Surya Roshni
Neutral
209
-
917
3,342
3,625
7.8
7.5
17.3
19.8
12.1
10.6
23.0
18.4
10.5
10.8
0.5
0.5
Team Lease Serv.
Neutral
1,039
-
1,776
3,229
4,001
1.5
1.8
22.8
32.8
45.6
31.6
4.9
4.2
10.7
13.4
0.5
0.3
The Byke Hospitality
Neutral
209
-
838
287
384
20.5
20.5
7.6
10.7
27.5
19.5
5.7
4.6
20.7
23.5
2.9
2.2
Transport Corporation of
Neutral
231
-
1,772
2,671
2,911
8.5
8.8
13.9
15.7
16.7
14.8
2.3
2.0
13.7
13.8
0.8
0.7
India
Stock Watch
April 19, 2017
Company Name
Reco
CMP
Target Mkt Cap
Sales ( Čcr )
OPM(%)
EPS (Č)
PER(x)
P/BV(x)
RoE(%)
EV/Sales(x)
(Č)
Price ( Č)
( Č cr )
FY17E FY18E FY17E FY18E FY17E FY18E FY17E FY18E FY17E FY18E FY17E FY18E FY17E FY18E
zOthers
TVS Srichakra
Neutral
3,636
-
2,784
2,304
2,614
13.7
13.8
231.1
266.6
15.7
13.6
408.5
321.6
33.9
29.3
1.2
1.0
UFO Moviez
Neutral
439
-
1,211
619
685
33.2
33.4
30.0
34.9
14.6
12.6
2.0
1.8
13.8
13.9
1.7
1.3
Visaka Industries
Neutral
318
-
505
1,051
1,138
10.3
10.4
21.0
23.1
15.1
13.7
40.8
38.2
9.0
9.2
0.7
0.7
VRL Logistics
Neutral
338
-
3,081
1,902
2,119
16.7
16.6
14.6
16.8
23.2
20.1
5.1
4.5
21.9
22.2
1.7
1.5
Wonderla Holidays
Neutral
382
-
2,157
287
355
38.0
40.0
11.3
14.2
33.8
26.9
4.8
4.2
21.4
23.9
7.2
5.8
VIP Industries
Neutral
189
-
2,665
1,270
1,450
10.4
10.4
5.6
6.5
33.7
29.0
7.0
6.1
20.7
21.1
2.1
1.8
Navin Fluorine
Buy
3,156
3,650
3,090
789
945
21.1
22.4
120.1
143.4
26.3
22.0
4.2
3.6
17.8
18.5
3.9
3.1
Source: Company, Angel Research; Note: *December year end; #September year end; &October year end; Price as on April 18, 2017
Market Outlook
April 19, 2017
Research Team Tel: 022 - 39357800
DISCLAIMER
Angel Broking Private Limited (hereinafter referred to as “Angel”) is a registered Member of National Stock Exchange of India
Limited,Bombay Stock Exchange Limited and Metropolitan Stock Exchange Limited. It is also registered as a Depository Participant with
CDSL and Portfolio Manager with SEBI. It also has registration with AMFI as a Mutual Fund Distributor. Angel Broking Private Limited is a
registered entity with SEBI for Research Analyst in terms of SEBI (Research Analyst) Regulations, 2014 vide registration number
INH000000164. Angel or its associates has not been debarred/ suspended by SEBI or any other regulatory authority for accessing
/dealing in securities Market. Angel or its associates/analyst has not received any compensation / managed or
co-managed public offering of securities of the company covered by Analyst during the past twelve months.
This document is solely for the personal information of the recipient, and must not be singularly used as the basis of any investment
decision. Nothing in this document should be construed as investment or financial advice. Each recipient of this document should make
such investigations as they deem necessary to arrive at an independent evaluation of an investment in the securities of the companies
referred to in this document (including the merits and risks involved), and should consult their own advisors to determine the merits and
risks of such an investment.
Reports based on technical and derivative analysis center on studying charts of a stock's price movement, outstanding positions and
trading volume, as opposed to focusing on a company's fundamentals and, as such, may not match with a report on a company's
fundamentals. Investors are advised to refer the Fundamental and Technical Research Reports available on our website to evaluate the
contrary view, if any.
The information in this document has been printed on the basis of publicly available information, internal data and other reliable
sources believed to be true, but we do not represent that it is accurate or complete and it should not be relied on as such, as this
document is for general guidance only. Angel Broking Pvt. Limited or any of its affiliates/ group companies shall not be in any way
responsible for any loss or damage that may arise to any person from any inadvertent error in the information contained in this report.
Angel Broking Pvt. Limited has not independently verified all the information contained within this document. Accordingly, we cannot
testify, nor make any representation or warranty, express or implied, to the accuracy, contents or data contained within this document.
While Angel Broking Pvt. Limited endeavors to update on a reasonable basis the information discussed in this material, there may be
regulatory, compliance, or other reasons that prevent us from doing so.
This document is being supplied to you solely for your information, and its contents, information or data may not be reproduced,
redistributed or passed on, directly or indirectly.
Neither Angel Broking Pvt. Limited, nor its directors, employees or affiliates shall be liable for any loss or damage that may arise from
or in connection with the use of this information.